
Data Maps and Infographics
Data maps and infographics provide a simplified synopsis of some of the more dense reports OHE produces. These colorful, simple, visual aids are tools to break down the meaning of the data.
Data Maps
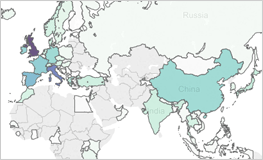
Where Minnesota Campuses are Located
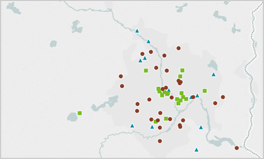
Where Students Study Abroad
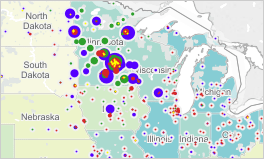
Where Minnesota High School Graduates Go to College
Infographics
Employment Outcomes of Graduates
![Employment Outcomes of Graduates [2 pages]](images/Workforce_Infographic_t.png)
Educational Disparities
![Educational Disparities Infographic [single page]](images/EdDisparitiesInfographic_t.png)
single page
![Educational Disparities Infographic [multiple pages]](images/EdDisparities_multInfographic_t.png)
multiple pages
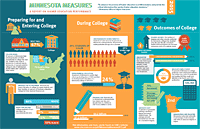
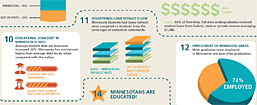
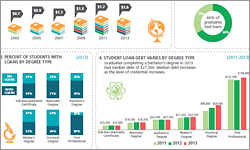
Minnesota Measures
2016
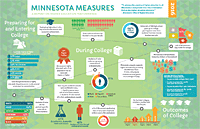
click to view: view the full report
2016
click to view: view the full report
2015
click to view: view the full report
2014
click to view: view the full report
Student Debt
click to view: view the full report [ Appendix ]
Then And Now
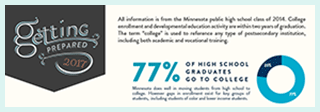
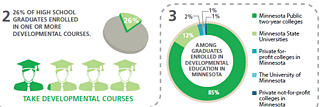
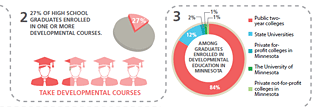
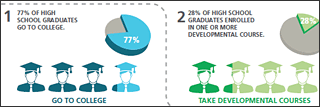
Getting Prepared
2017
click to view: 2017 Getting Prepared Report
2016
click to view: 2016 Getting Prepared Report
2015
click to view: 2015 Getting Prepared Report
2014
click to view: view the full report
Please Note:
- Accessing the Microsoft Excel file(s) on this page may require you to
download the free Excel Viewer from Microsoft
Note: documents in Portable Document Format (PDF) require Adobe Acrobat Reader 5.0 or higher to view.
Quick Links
- Why College?
- Explore Your Interests & Careers
- Prepare at School
- Summer Academic Enrichment Program
- The Many Ways to Earn Credit for College
- Recommended High School Classes & Graduation Requirements
- Advice for Students with Disabilities
- Succeed as an Adult Student
- Useful College Prep Resources
- Minnesota Goes to College!
- Collecting Data from Minnesota Postsecondary Institutions
- Campus Financial Aid Administrator Resources
- Campus Student Enrollment Reporting Resources
- Ordering Materials for Your Students
- Supplementing Your College Counseling
- Early Awareness Efforts
- Student Homelessness in Higher Education Resources
- Shared Library Resources
- MN FAFSA Tracker
- Campus Sexual Violence Prevention and Response
- Statewide FAFSA Filing Goal
- MyHigherEd
- Online Applications
- About Financial Aid
- What Does College Cost?
- Tips for Lowering the Cost of Higher Education
- Institutional Payments
- Financial Aid You Don't Repay
- Financial Aid You Must Repay (Student Loans)
- Financial Aid You Earn
- Military Service Education Benefits
- Reduced Out-of-State Tuition Options
- Education Tax Benefits
- Public Service Loan Forgiveness
- Ready, Set, FAFSA!
- North Star Promise
- Minnesota Paramedic Scholarship
- Data Maps and Infographics
- Educational Attainment Goal 2025
- Minnesota P-20 Statewide Longitudinal Education Data System
- Minnesota Measures
- Student Enrollment Data
- College Readiness & Participation Data
- Degrees, Graduation Rates, Attainment & Outcomes
- Tuition & Fees Data
- Student Health and Safety
- Financial Aid Data & Trends
- Institution and Data Search
- Transfer Students
- Research Reports
- A-Z Data Table Index
- Postsecondary Funding
- Special Student Populations